Power BI Consultancy

Transparity provides Business Intelligence consultancy solutions to help you maximise business decisions

Transforming Data into Actionable Insights with Transparity's Power BI Consultancy Experts

Leveraging the robust capabilities of Power BI, businesses can unlock unprecedented insights from their data. Our Power BI consulting guides organisations through the implementation process, ensuring that Power BI’s advanced analytical tools and interactive dashboards are tailored to meet specific business needs.

With our Power BI consultant’s support, stakeholders can access real-time data visualisations that evolve as the data changes, ensuring they always have access to the most current information. This adaptability is crucial for responding to emerging trends and issues swiftly and effectively.

Data & AI Advanced Specialisation

Find Out How Microsoft Programmes Can Fund Your Data Journey

Transparity has a direct relationship with Microsoft and can leverage funding to aid you with your business intelligence solutions.

The First Stage of Successful Business Intelligence Consulting Services is Implementing a Modern Data Platform

For Power BI to create the reports and dashboards your organisation needs to gain valuable insights into data and trends, you need your data in good shape. That’s where a modern data platform comes in, allowing you to smoothly ingest, store, process and manage your data accurately. Giving you peace of mind on the validity and accuracy of your reports.

Data Ingestion

Data ingestion collects and imports data from sources like databases, cloud storage, IoT devices, and social media into a central repository. Effective tools gather data in real-time or batch mode while preserving integrity for analysis.

Data Storage

Data storage solutions are essential for managing large volumes of structured and unstructured data. Contemporary data platforms utilise cloud-based storage options such as data lakes and data warehouses, which provide scalable and flexible storage capacities.

Data Processing

Data processing engines are used to transform raw data into usable information. Tools such as Apache Spark enable large-scale data processing by performing complex computations efficiently. This stage involves data cleaning, transformation, and integration, making it feasible to analyse data and extract insights for business decisions.

Data Management

Data management includes policies, procedures, and technologies for ensuring data accuracy, quality, and security. Effective practices involve data governance to establish ownership and accountability, measures for consistent and reliable data quality, and protocols to protect against unauthorized access and breaches.

Get in touch today to discuss Transparity implementing your business intelligence solutions

Reach out to us through our contact form, and we’ll respond to you promptly to ensure you get the support you need. Your success is our priority, and we look forward to becoming your Microsoft Power BI partner.

“Our mentality was that while we’re young and agile, let’s implement the right infrastructure as early as possible. It was all about finding the right partnership to get this in place. What we have achieved is a really robust and stable data model that gives us the ability to provide retail insights across all of our customers”

Trent Powell
Project and Product Manager, Versilia

Stage Two of Business Intelligence Consultancy is Providing Valuable Insights Through Dashboards and Reports

Organised data sets can then be transformed into comprehensive Power BI dashboards that visualise key metrics and trends through various charts and interactive elements. Power BI’s advanced features provide a clear narrative, allowing users to quickly grasp the most critical information. By integrating drill-down capabilities, users can delve into deeper layers of data, uncovering correlations and patterns that might not be immediately apparent. This fosters a detailed understanding of various business aspects, driving informed decision-making and strategic actions.

Data Analytics

Data analytics tools facilitate organisations in querying, analysing, and visualising data to identify patterns, trends, and insights. Power BI offers robust analytics capabilities, enabling users to generate comprehensive reports that aid businesses in making informed decisions based on actionable insights derived from their data.

Data Visualisation

Data visualisation tools transform raw data into graphical representations such as charts, graphs, and dashboards. These visual formats enhance the understanding of complex data sets and facilitate the communication of insights to stakeholders. By presenting data in a clear and accessible manner, data visualisation tools enable organisations to identify trends, monitor performance, and make decisions grounded in informed analysis.

Visualised Dashboards

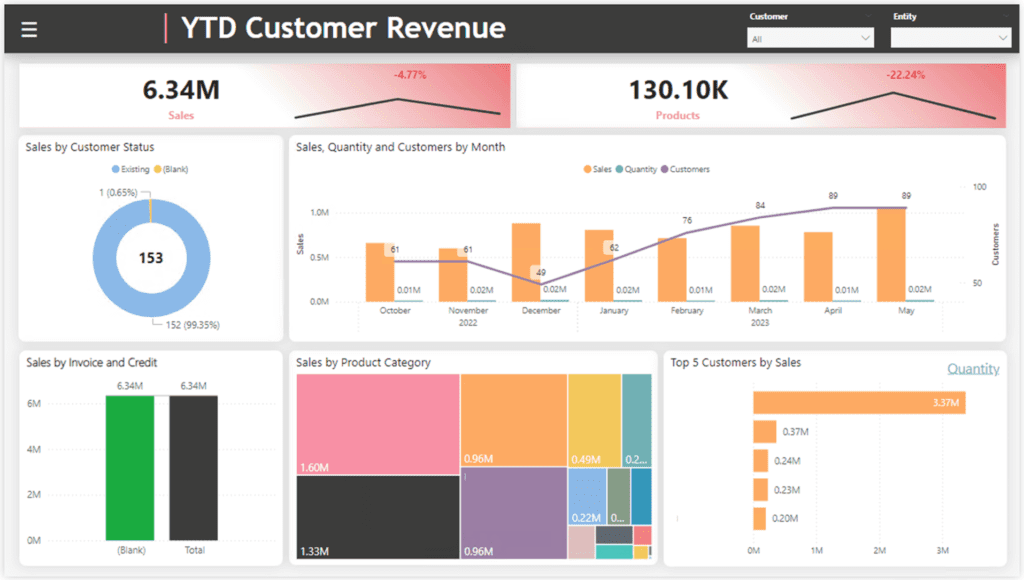
Our primary objective is to develop visualised dashboards using Power BI that enable drill-down functionalities and effective storytelling, offering both overarching summaries and detailed insights. Through our Power BI consultancy service, we specialise in delivering these dashboards, converting intricate data sets into intuitive and interactive visuals that enhance the comprehension and analysis of key metrics.

Transparity leverages the full capabilities of Power BI by creating a wide array of charts, graphs, and other visual elements that emphasise trends and patterns. By allowing users to conduct an in-depth analysis of the data, these dashboards facilitate a thorough comprehension of the information presented. This, in turn, supports informed decision-making and strategic planning.

Image of data analytics in a visual report

Paginated Reports

Paginated reports present detailed tables necessary for in-depth analysis during board meetings or strategic planning sessions, ensuring stakeholders receive precise data in an easily digestible format. While interactive dashboards offer visual appeal and intuitive exploration, paginated reports created through Power BI deliver critical information required for high-stakes scenarios.

Transparity ensures these reports are customised to meet the specific requirements of different teams, enabling decision-makers to access essential data presented effectively. By leveraging the full capabilities of Power BI, Transparity transforms intricate data sets into powerful, actionable insights that drive informed decision-making and strategic planning.

Power BI Architecture

Our Power BI Consultants can determine the best architectural set up for your organisation’s requirements. Some common scenarios include:

Solution Delivered within Power BI

Solution Delivered with Power BI Complementing the Azure Data Platform

Solution Delivered with Power BI and Microsoft Fabric

Our Data Experience

Transparity’s team of data engineering consultants are trusted by 100s of organisations to design, implement and manage Microsoft data services.

As an Azure Expert MSP with additional specialisations in Data Warehouse Migration and AI Platform, our team have a wealth of experience to support customers on their data and AI journey.

Fabric MVPs & Deployments
0 +
In the UK for Microsoft Azure Innovate Funding
# 1

Customer Success Stories

NHS Bucks Azure Databricks Platform Case Study
Discover how NHS Buckinghamshire improved patient care and data management with an Azure Databricks Platform.
Discover how BW: Workplace Experts used Microsoft Fabric to unlock real-time insights, boost safety and save 4 days a month on reporting!
Transparity delivered a Jewish Care GDPR compliance PowerApps solution, streamlining processes to ensure secure, efficient handling of sensitive data. Using Microsoft Power Platform and SharePoint, we enabled full compliance and improved operational transparency.

The Transparity Guide to Power BI and Enhancing Your Reports

We now have access to more data than ever before, with a world of insights at the push of a button. But, without effective data management and reporting, it’s difficult to put these insights into action – enter Power BI.

In this guide, we look at:

  • Why and how to visualise
  • The most common challenges in visualising data in Power BI
  • The future of data visualisation

FAQs

Power BI is a suite of business analytics tools by Microsoft that allows you to visualise your data, share insights across your organisation, or embed them in an app or website. It offers capabilities for connecting to hundreds of data sources, simplifying data prep, and driving ad hoc analysis.

Business intelligence (BI) consulting involves providing expert advice and solutions on how to collect, store, and analyse data to help organisations make informed business decisions. BI consultants help to implement and optimise BI tools, like Power BI, to meet specific business needs.

  • Data visualisation: Create intuitive and interactive dashboards and reports.
  • Integration: Connect to various data sources like Excel, databases, and cloud services.
  • Real-time insights: Gain real-time insights through live dashboards.
  • Collaboration: Share reports and dashboards with colleagues and stakeholders.
  • Data-driven decisions: Empower your organisation to make data-driven decisions.

Power BI can enhance the capabilities of the Azure Data Platform by providing advanced data visualisation and reporting features. It can connect seamlessly with Azure services like Azure SQL Database, Azure Data Lake, and Azure Synapse Analytics to create comprehensive and interactive analytics solutions.

Power BI consultants typically have extensive experience in data analytics, data modelling, data integration, and dashboard/report creation. They are skilled in using various data sources and tools, ensuring that the solutions they provide are tailored to meet the specific needs of your organisation.

Yes, several related data services can complement Power BI, such as:

  • Azure Synapse Analytics
  • Azure Data Factory
  • Azure SQL Database
  • Microsoft Fabric

These services can help you build a robust data infrastructure, streamline data integration, and enhance your analytics capabilities.

[mwai_chatbot id="chatbot-8s20vg"]
Skip to content