As a trusted provider in data analytics consulting solutions, Transparity helps you maximise business decisions through effective data visualisation
Getting your data into shape is all about gaining valuable insights that can drive business decisions. The output of your modern data platform is those dashboards and reports which allow you to see at a glance the information and numbers you need.
Furthermore, these visualisations are not static; they evolve with the data, offering real-time insights that can adapt to changing circumstances. This dynamic approach ensures that stakeholders are always equipped with the most up-to-date information, facilitating timely and effective responses to emerging trends or issues.


Transparity has a direct relationship with Microsoft and can leverage funding to aid you in your data analytics projects.
Once data is organised, it can be translated into comprehensive dashboards that visualise key metrics and trends through various charts and interactive elements. These dashboards provide a clear narrative, allowing users to quickly grasp the most critical information. By integrating drill-down capabilities, users can explore deeper layers of data, uncovering correlations and patterns that might not be immediately apparent. This helps in forming a more detailed understanding of various business aspects, thus driving informed decision-making and strategic actions.
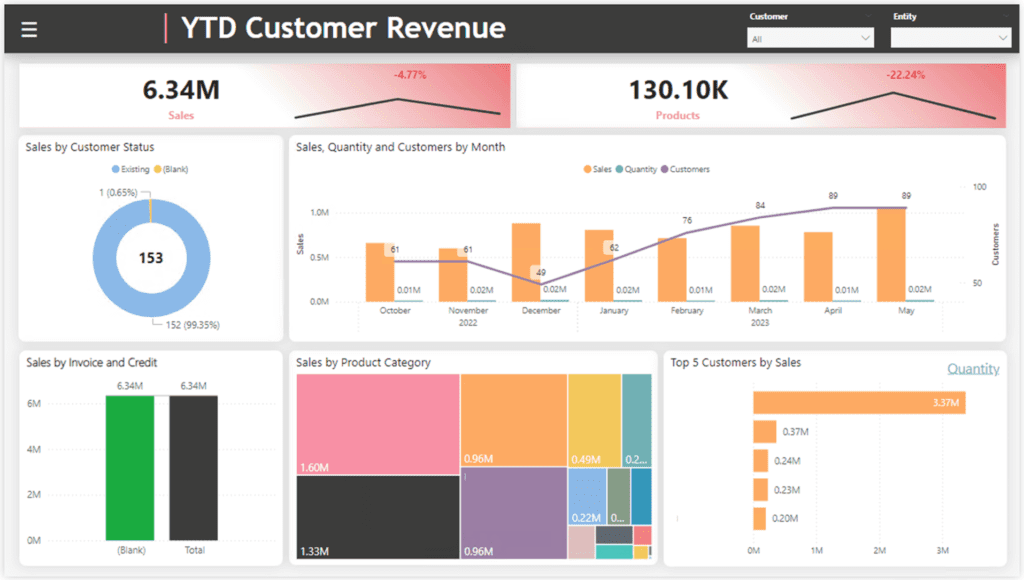
Ultimately, the goal of Transparity’s data visualisation and data analytics consulting services is to create a visualised dashboard that allows for drill-down capabilities and storytelling, providing both high-level overviews and granular insights. Such dashboards can transform complex data sets into intuitive, interactive visuals that make it easier for users to understand and analyse key metrics.
This can be achieved through various charts, graphs, and other visual elements that highlight trends and patterns. By offering the ability to delve deeper into the data, these dashboards facilitate a comprehensive understanding of the information at hand, enabling more informed decision-making and strategic planning.
Transparity can also provide data analytics consulting solutions through paginated reports which are generated to present the detailed tables necessary for in-depth analysis during board meetings or strategic planning sessions. These reports are useful for delivering precise data in a format that is easily digestible for stakeholders.
They might not be as visually appealing as interactive dashboards, but they provide the critical information required for strategic planning sessions and other high-stakes scenarios. By tailoring these reports to meet the unique needs of different departments or teams, organisations can ensure that every decision-maker has access to the data they need, presented effectively.
As a trusted provider of data analytics consulting, Transparity excels at transforming raw data into strategic assets that drive business success. By leveraging advanced data processing techniques and implementing modern data platforms, Transparity delivers comprehensive solutions through visualised dashboards, paginated reports, and tailored data insights for specific reporting requirements.
Creating reports as the output for your data engineering project is fundamental in ensuring that the raw data is transformed into meaningful, actionable insights. This process involves a meticulous approach to data collection, cleansing, and organisation.
Once the data is well-structured, it can be visualised through comprehensive dashboards. These dashboards and reports not only display key performance metrics and trends but also allow for interactive elements that enable users to drill down into the data, uncovering deeper narratives and insights that drive informed decision-making.
In some cases, the need for specific reports can manifest as a siloed project within an organisation. This often occurs when individual departments or teams require tailored data insights to address their unique challenges and objectives. Though it is better to work within a full data strategy, our team is always on-hand for ad-hoc projects.
By focusing on the immediate needs of these departments, we can deliver reports that empower them to make informed decisions. This targeted approach allows departments to act swiftly and effectively. This way, organisations can maintain momentum and agility in a fast-paced environment.
Having implemented a modern data platform, you now have the flexibility to slice and dice your information as different needs arise. We can work with you on individual projects or through a longer term retainer model. This approach supports the creation of dynamic reports and dashboards created to suit current business requirements.
By leveraging advanced data processing capabilities and integrating AI-driven analytics, a modern data platform enables users to explore data from multiple angles, uncovering hidden patterns and correlations. This adaptability ensures that the data remains relevant and actionable, empowering organisations to stay ahead in a rapidly evolving business landscape.
“Our mentality was that while we’re young and agile, let’s implement the right infrastructure as early as possible. It was all about finding the right partnership to get this in place. What we have achieved is a really robust and stable data model that gives us the ability to provide retail insights across all of our customers”
Transparity’s team of data engineering consultants are trusted by 100s of organisations to design, implement and manage Microsoft data services.
As an Azure Expert MSP with additional specialisations in Data Warehouse Migration and AI Platform, our team have a wealth of experience to support customers on their data and AI journey.
We now have access to more data than ever before, with a world of insights at the push of a button. But, without effective data management and reporting, it’s difficult to put these insights into action – enter Power BI.
In this guide, we look at:
Data analytics is the process of examining data sets to draw conclusions about the information they contain. It involves using various techniques and tools to extract valuable insights, which can help organisations make informed decisions.
Data visualisation is the graphical representation of data. By using charts, graphs, and maps, data visualisation makes complex data more accessible and understandable, enabling users to see patterns, trends, and outliers that might not be evident from raw data.
These consultants transform raw data into valuable insights using advanced analytical techniques and visual representations. They assist organisations in selecting the right tools and methods to analyse data, uncover patterns, and identify trends. Through interactive dashboards and reports, they make complex data understandable, driving data-driven decision-making.